Understanding the HQ Portal
CodeTogether HQ offers a comprehensive portal interface with three key components: the Project dashboard, the Activity dashboard, and Work Logs. The portal also provides access to project and user settings, as well as high-level system settings. To open the CodeTogether HQ portal, open your browser to the URL provided by your team lead or system administrator.
Project Dashboards
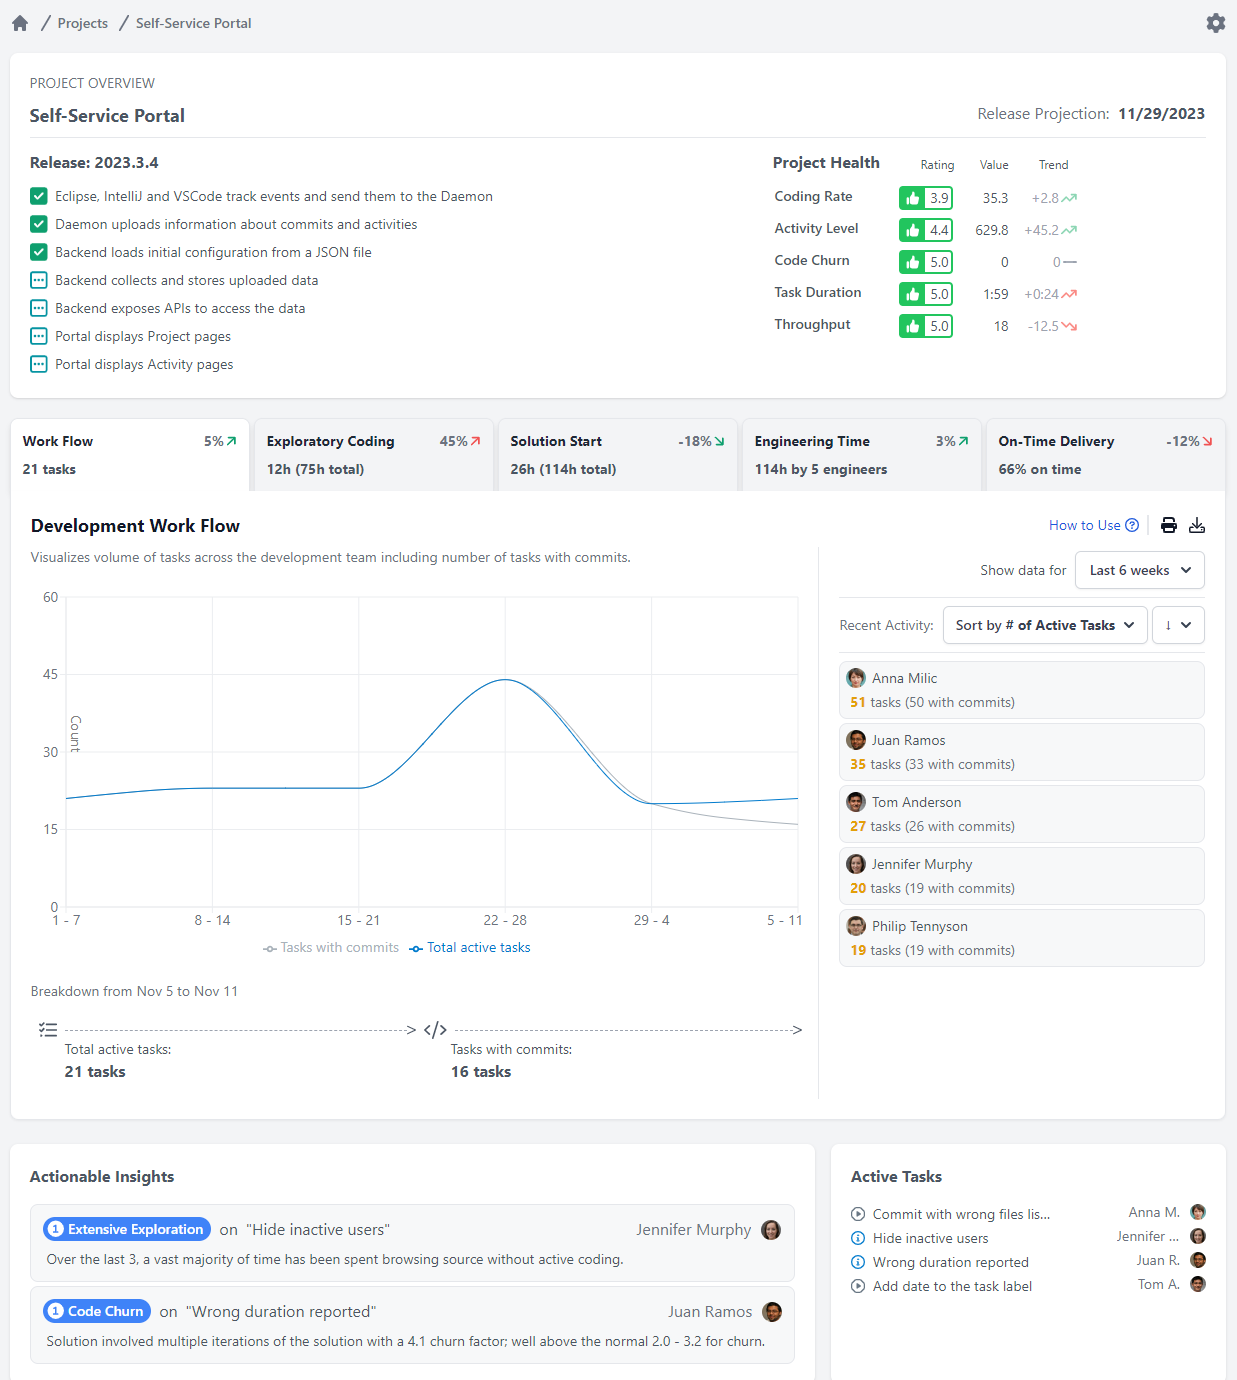
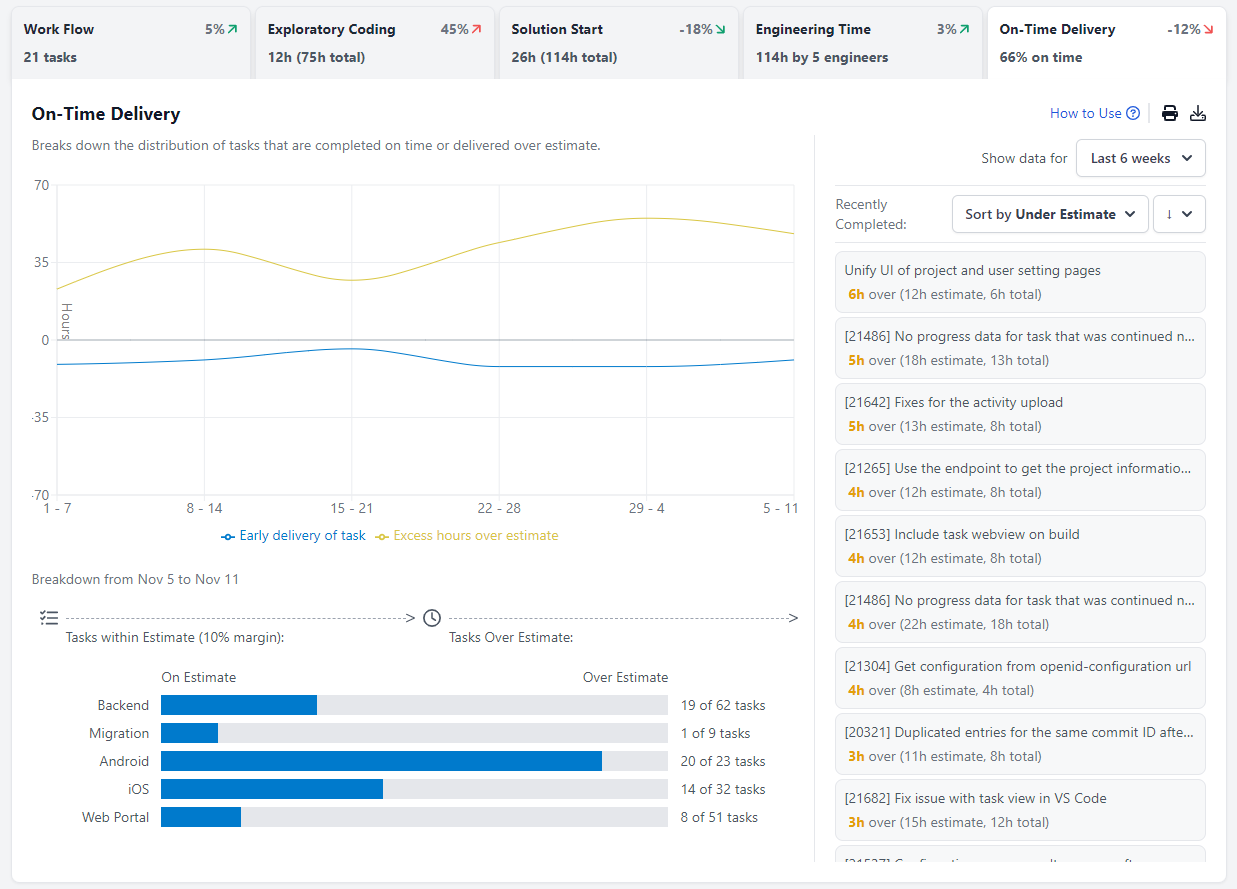
Project dashboards in CodeTogether HQ serve as a gateway to a high-level perspective of project data, giving stakeholders and team members a visually engaging overview of project status and performance. Customizable graphs and data points can be tailored through project settings to meet specific monitoring needs. Additionally, these dashboards can leverage external integrations to enhance functionality, like the On-Time Delivery graph that requires linkage with services such as Jira.
Workflow
The Workflow graph provides insight into team dynamics by visualizing task completion trends on a week-over-week basis. It can disaggregate tasks into components, illustrating not just quantities but also the areas in which tasks are completed. This dual perspective helps understand both throughput and the distribution of work across the software's architecture. The graph further drills down into individual developer contributions, offering a clear picture of productivity and pinpointing areas of high performance or potential bottlenecks.
Exploratory Coding
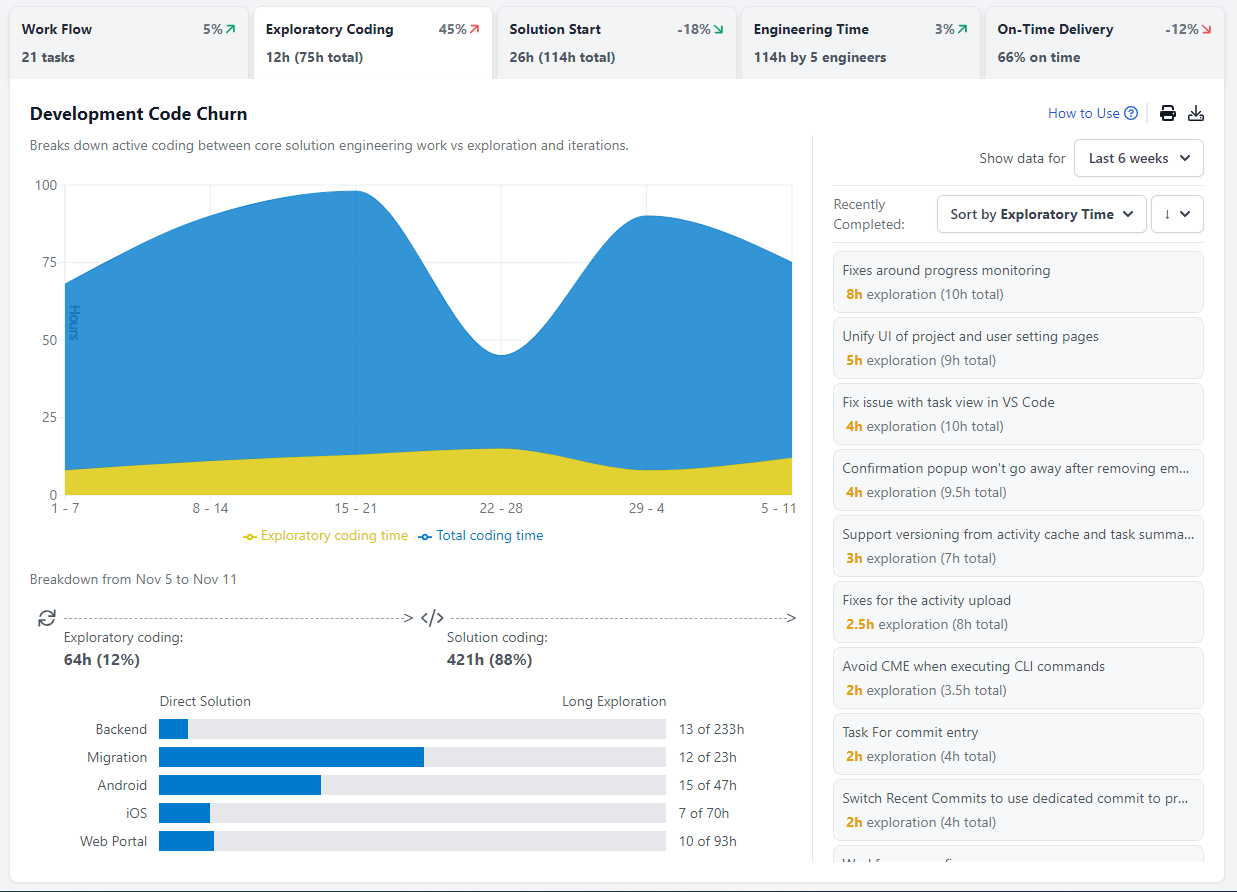
The Exploratory Coding graph demystifies code iteration processes, revealing the frequency and intensity of code churn—a measure of how often code is revised before it's deemed final. Unlike traditional assessments at commit or review checkpoints, CodeTogether HQ's analysis reveals churn during active development. By exploring component-level churn, users gain insights into code complexity and identify components requiring excessive rework, guiding efforts to streamline development in these areas.
Solution Start
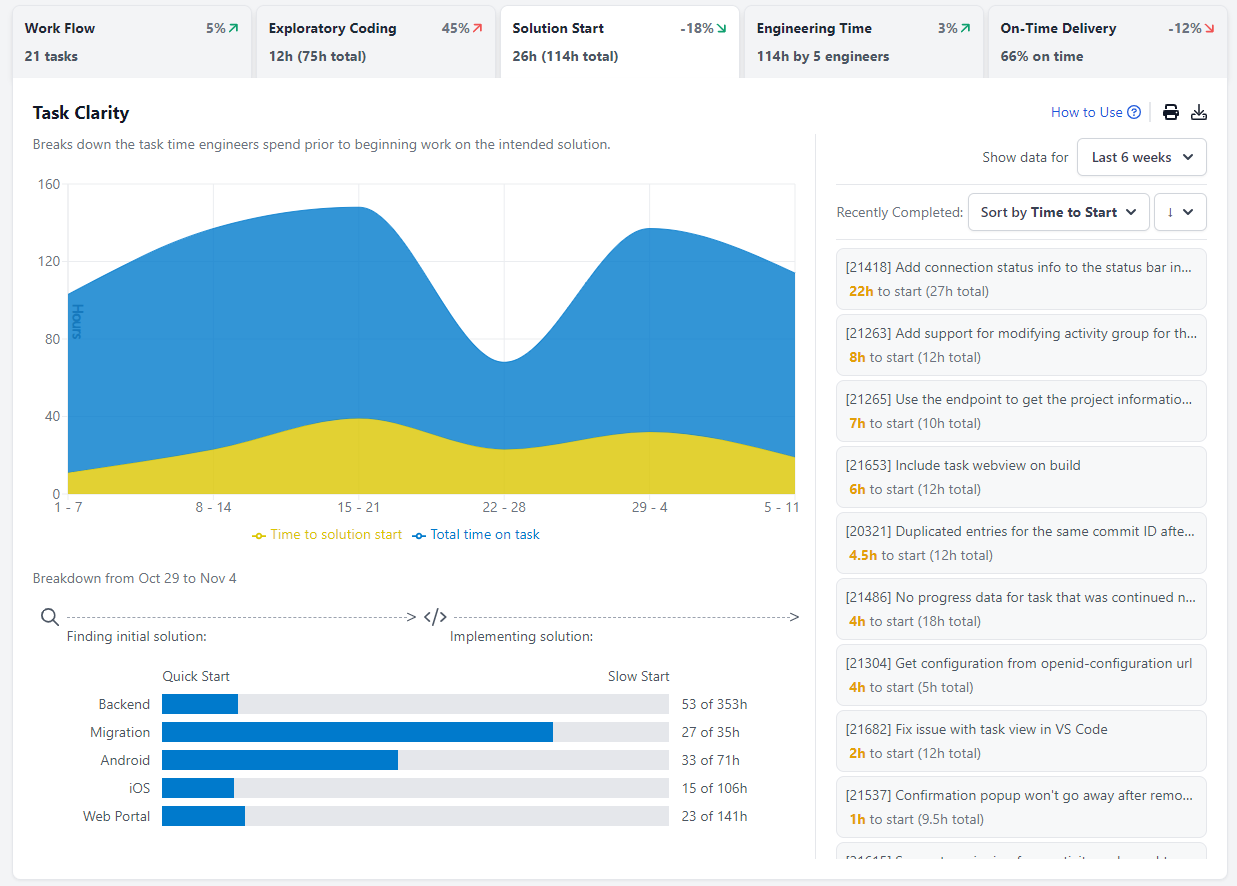
The Solution Start graph zeroes in on the initiation phase of tasks, analyzing how swiftly developers embark on them. Estimating when foundational work begins facilitates understanding of task distribution efficiency. Identifying components or tasks with delayed starts offers valuable intel on process bottlenecks. It might suggest the need for clearer definitions or a reevaluation of requirement gathering processes. Observing patterns in components can spotlight areas that are inherently more challenging.
Engineering Time
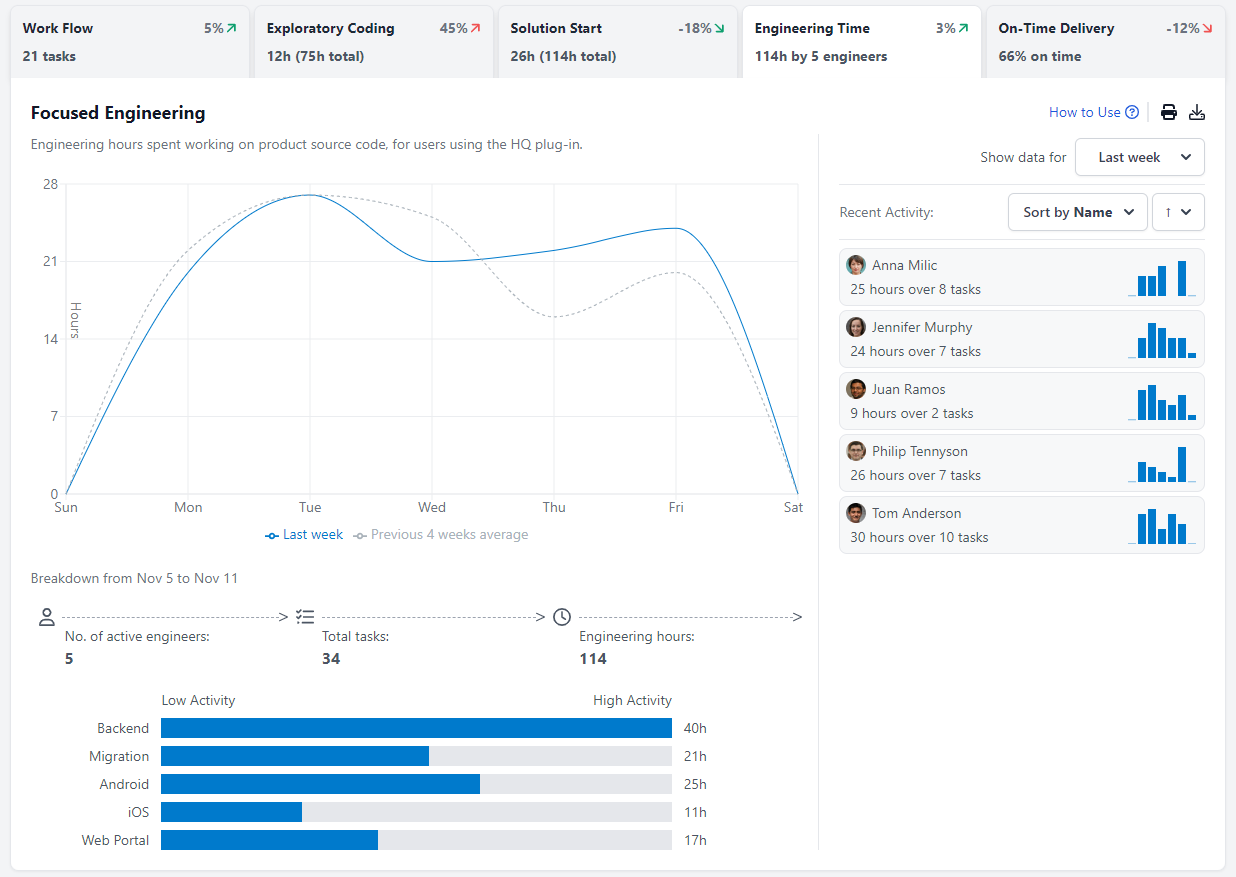
The Engineering Time graph sheds light on when and where focused engineering occurs. By splitting engineering time across days and components, one can discern peak productivity periods and high-attention areas within the product codebase. This intel catalyzes strategic planning, such as minimizing meetings during high productivity blocks, and nurturing an environment conducive to focused, uninterrupted engineering work.
On-Time Delivery
The On-Time Delivery graph becomes actionable with integrations like Jira. It tracks task completion against estimates, providing a feedback mechanism into project management platforms. CodeTogether HQ's meticulous tracking allows for a detailed analysis of how each component aligns with planned timelines. Dissecting overdue areas facilitates refined task estimation and forecasting, bolstering the chances of meeting project deadlines and achieving on-time delivery of products.
Activity Dashboards
Activity dashboards in CodeTogether HQ provides a comprehensive overview of the engineering work across a group of individuals. By default, there is an Activity dashboard for each project that you have access to. Additionally, you can create activity groups within a project to subdivide the team and focus on specific tasks.
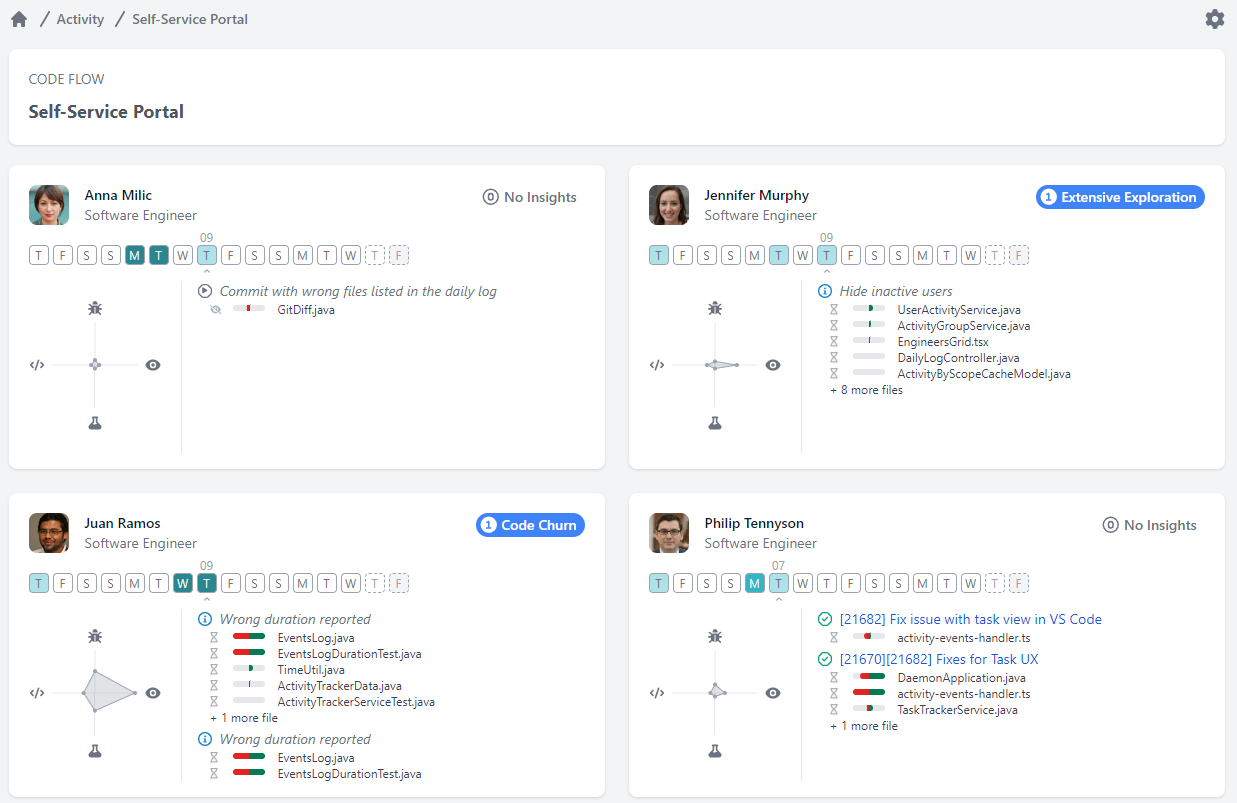
Daily Work
Within the Activity dashboard section for each developer, you can observe boxes representing the amount of work the engineer has done on specific days of the week. Hovering over these days updates the other sections to visualize the type of work and tasks the developer was involved in. The coloring of the box indicates the volume of work conducted on a given day.
Recent Commits
Within a specific day on the engineer's Activity dashboard, you can view recent commits and tasks. This section shows both committed and in-progress activities of the developer. By clicking on the task title, you can drill in and obtain more details, including all the files changed. CodeTogether HQ also provides visualizations for the type of work performed, such as time spent browsing or coding. Having visibility into the amount of time spent allows you to enhance code review and focus on reviewing the most challenging code portions.
Radar Graph
To the left of the commits and tasks section, you will find a radar graph. This graph offers insights into the developer's focus during a given day. It showcases whether the developer spent a significant amount of time coding, debugging, running tests, or browsing and exploring the source code. This information is valuable when reviewing work, as it allows you to understand the engineer's areas of focus, such as extensive coding, problem investigation, or code exploration.
Work Logs
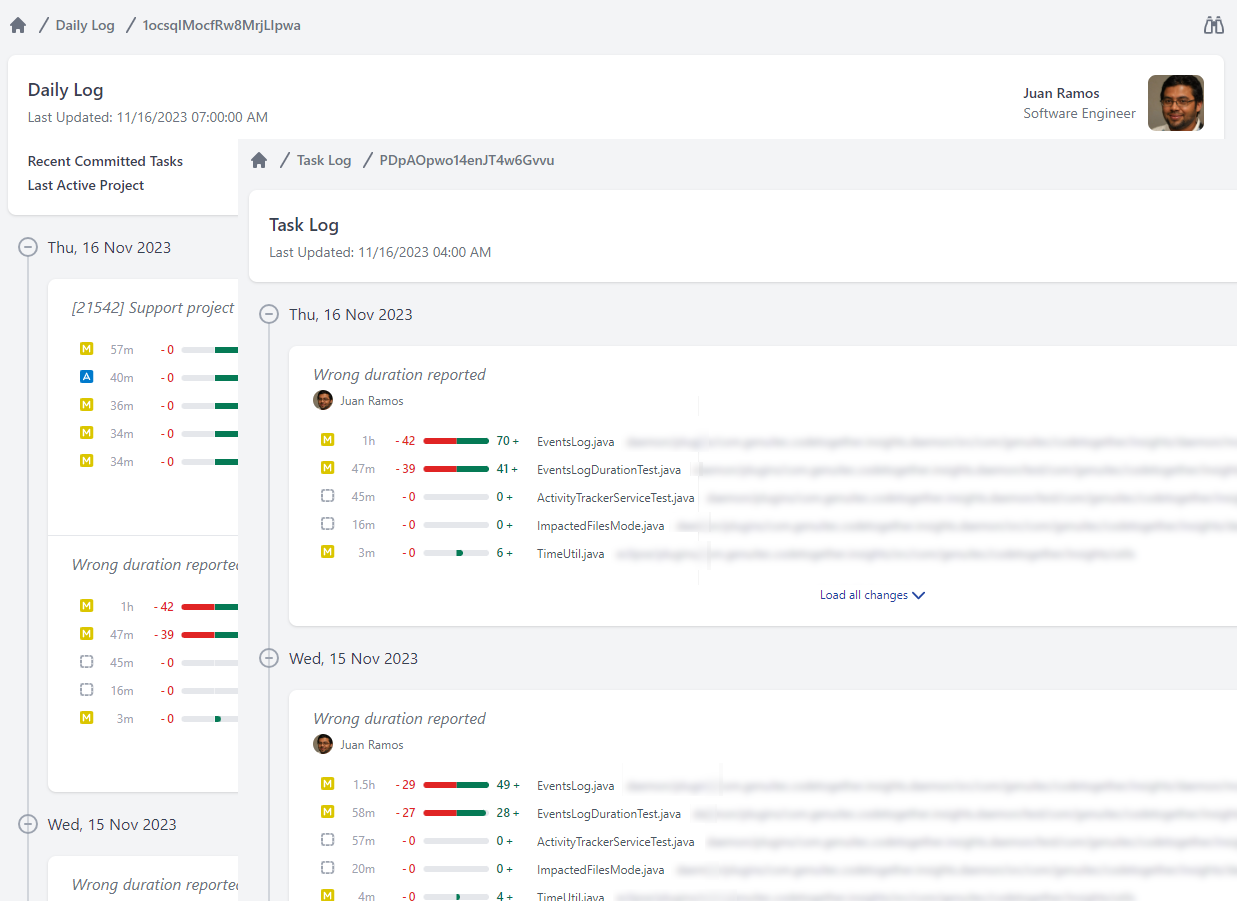
The Work Logs feature in CodeTogether HQ allows engineers to track and review their daily progress and work activities, providing valuable insights into the evolution of their tasks. Work Logs can be accessed for a given task or by clicking on an engineer. Engineers can view a chronological log of their comments and work in progress, enabling them to understand how their work has evolved over time. This feature is particularly beneficial for tasks that span multiple days, as it allows engineers and mentors to review the approach taken during development and gain a comprehensive understanding of the work.
Reports
CodeTogether HQ provides a variety of useful reports to help you to maximize productivity. If you can't find the exact report you need, email our support team at support@codetogether.com and we may be able to help.
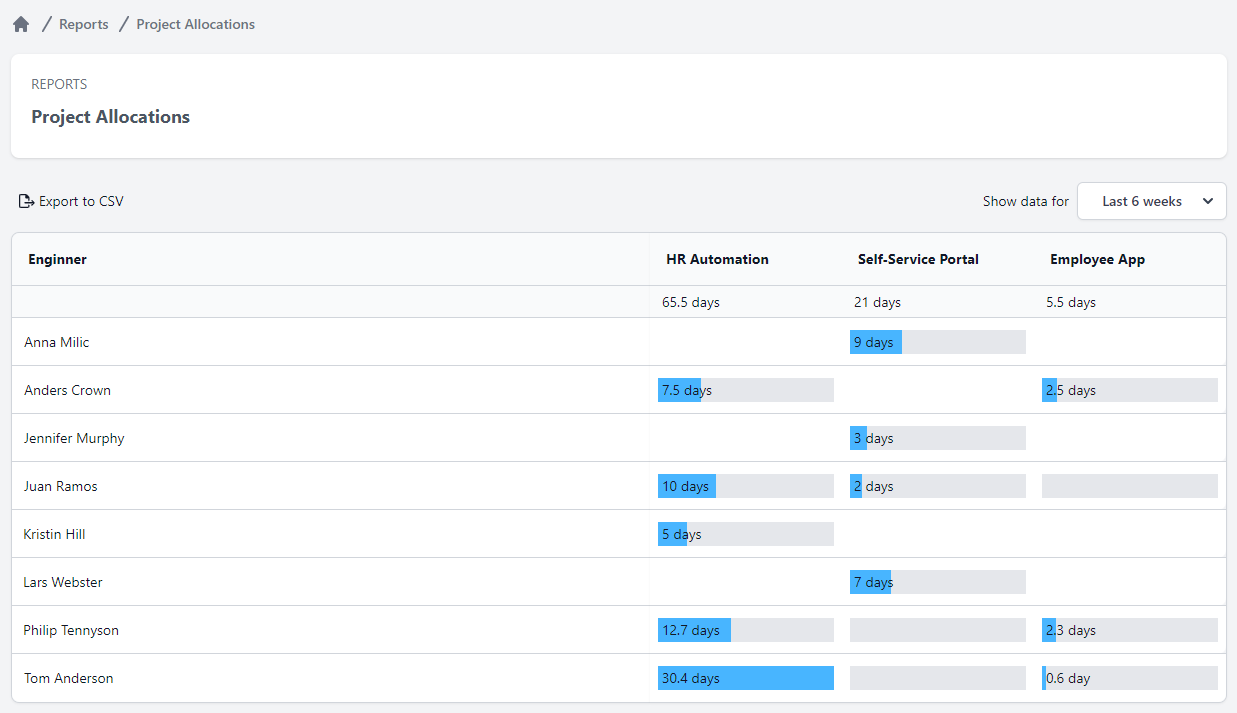
Project Allocations Report
The Project Allocations Report improves operational oversight by showing the allocation of developers across projects. Use this report to better understand the efforts and investment of developers in your organization. The report assigns work in day increments based on the activity detected by the system.
Source Activity Report
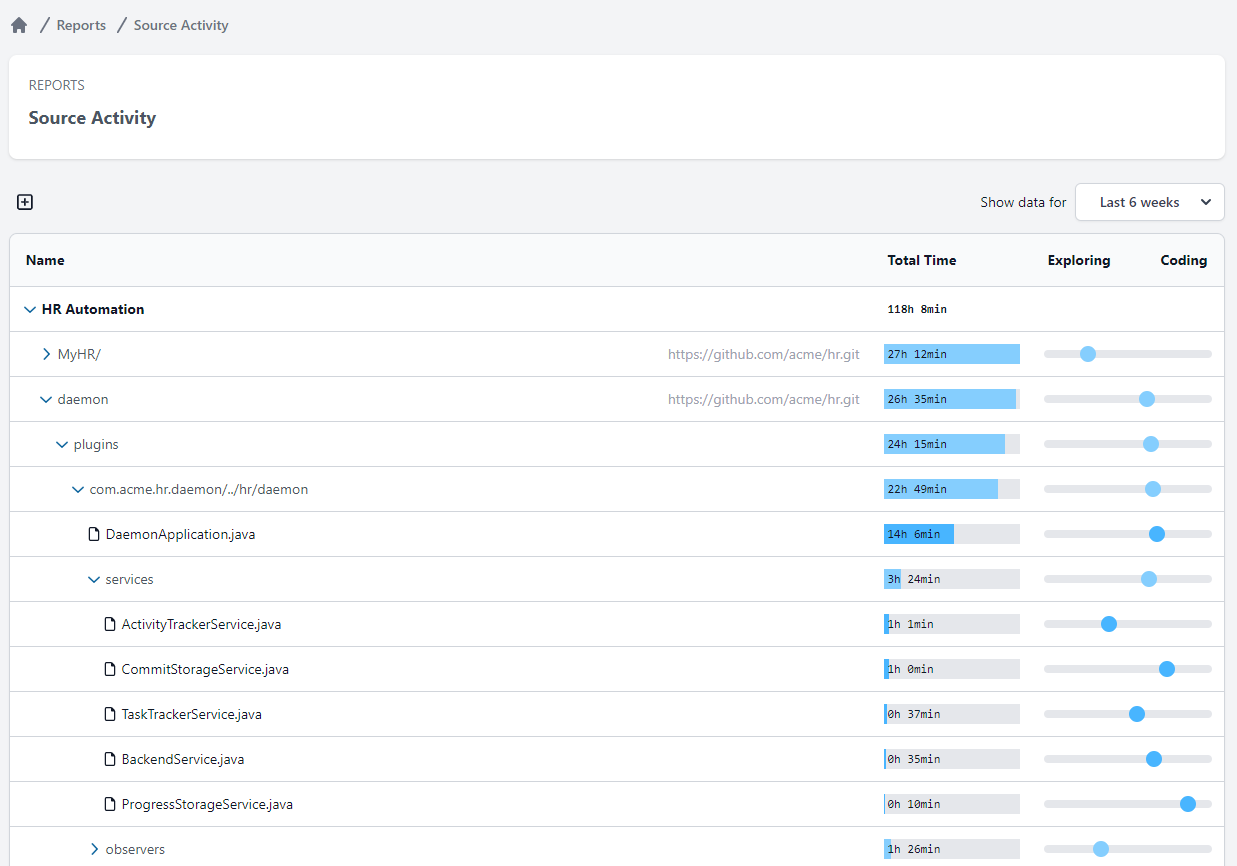
The Source Activity Report improves engineering transparency by giving a breakdown of where time is being spent both across projects as well as in the different areas of the source code. Additionally, it offers insights into the type of work happening in those areas (e.g., heavy exploration, heavy coding, etc.).
Project Settings
Access to the project settings page offers a comprehensive configuration interface for project-related preferences and options. By navigating to either the Project dashboard or the Activity dashboard, users locate and select the Gear icon situated in the top-right corner, corresponding to the project they wish to customize. This action reveals an array of settings segmented into intuitively organized sections, each tailored to different project parameters and team needs.
Overview
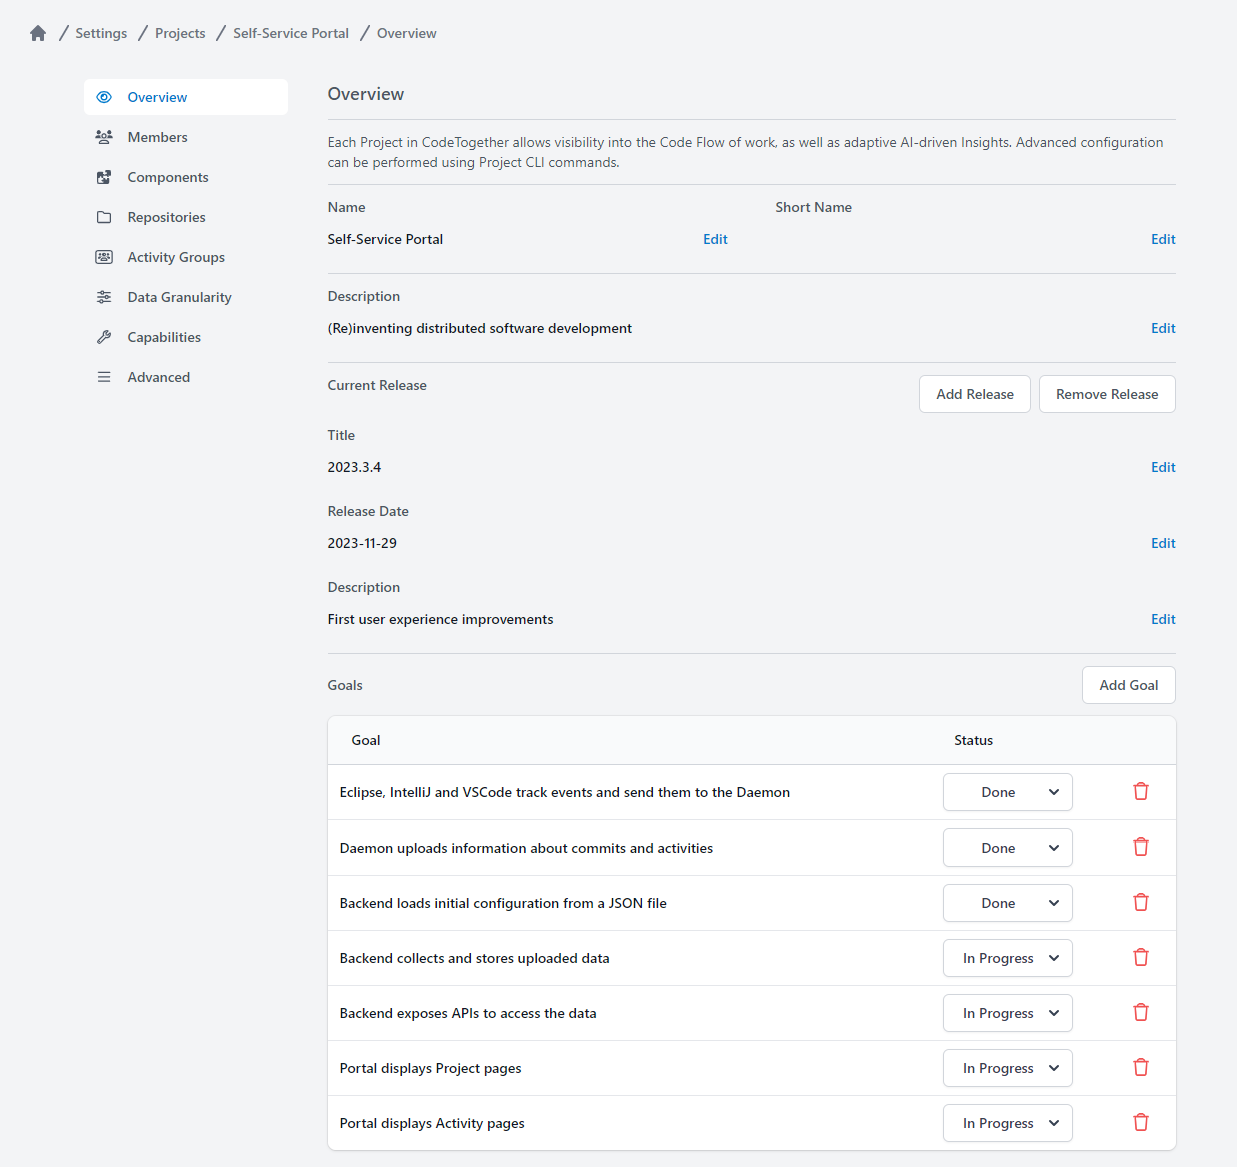
The Overview section serves as the central hub for high-level project details. It’s designed for the input and presentation of essential project information—project name, descriptive elements, and crucial milestones such as anticipated release dates and the objectives targeted for each release. These pieces of data not only facilitate an immediate and informative snapshot but are also prominently featured on the Project dashboard to enhance visibility and transparency of the project's development trajectory for all stakeholders.
Members
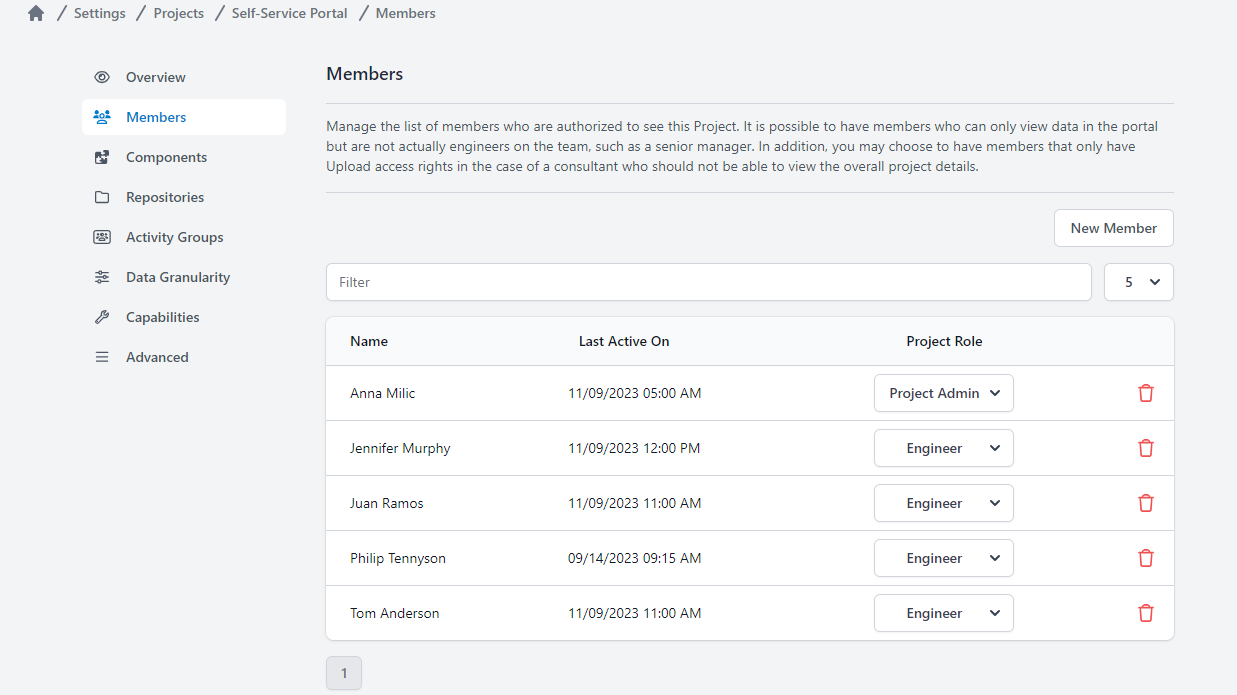
The Members section acts as the access control panel for the project. This vital area allows those with project administrator privileges to assign and manage user roles—ranging from developers actively working on the project to observers whose interaction is limited to monitoring reports and tracking progress. Project administrators find the tools needed here to invite new members, define their roles, and, if necessary, revoke access, ensuring the right personnel have appropriate levels of interaction within the project's lifecycle.
Components
Management of source code segments is the primary directive of the Components area. Users can define and oversee the various portions of code that receive analytical attention, therein optimizing understanding of workload distribution. It is advised to categorize moderately sized, cohesive sections of code—like layers or entire applications—into intelligible segments. Recognizing that the distribution of workload often diverges from initial expectations, this section offers flexibility through easily modifiable component definitions; any alterations are dynamically reflected across past and present data for immediate effect.

Repositories
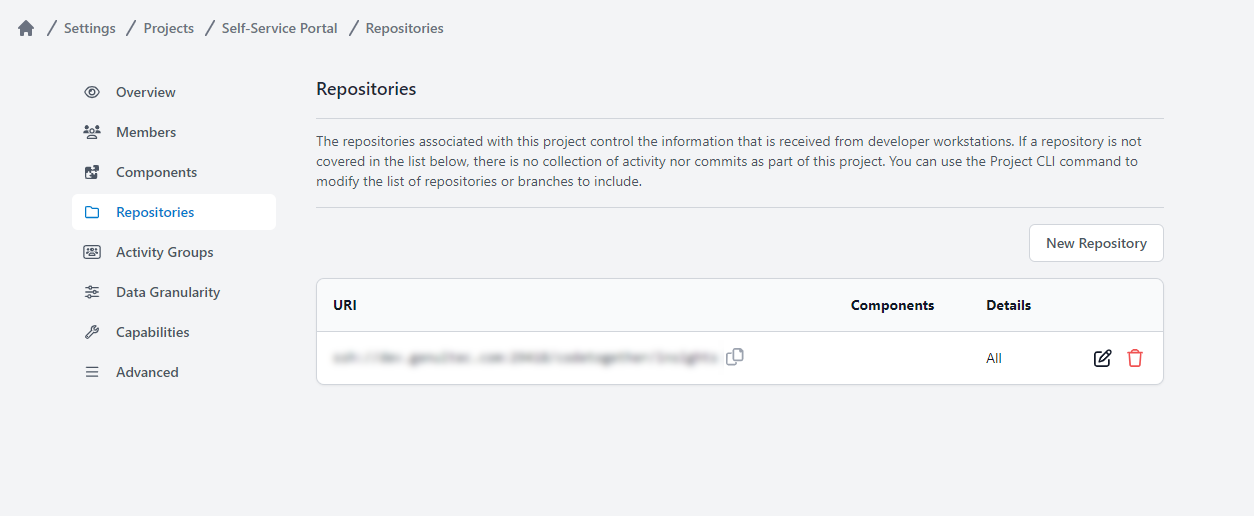
The Repositories section aims to provide central management for the integration of Git repositories associated with the project. Through the addition of one or several Git repository URIs, users ensure that the system acknowledges and appropriately handles the disparate access methods used by developers—such as the GIT and HTTPS schemes—thereby maintaining a united data environment. Compatibility with the HQ plugin is contingent on repository registration within this section, compelling the collection and analysis of data strictly from recognized sources.
Activity Groups
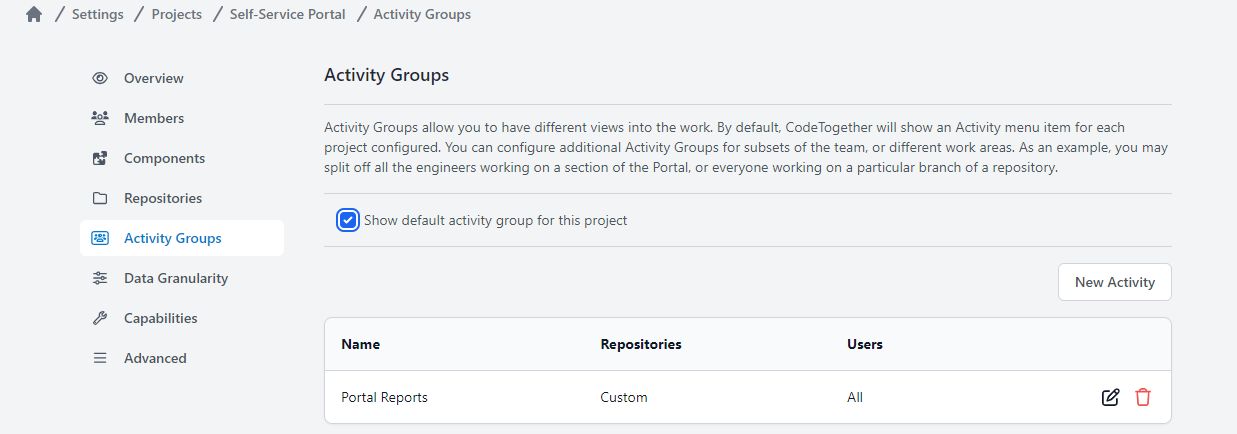
Activity Groups, a feature first mentioned in the context of the Activity dashboard, allows for the compartmentalization of the team into distinct subgroups. This functionality offers differentiated perspectives based on subdivision parameters—often aligning with structural divisions such as UI or backend teams. With this, project managers can tailor the Activity dashboards to showcase only the relevant work and progress pertaining to each specialized group, enabling focused oversight and management.
Data Granularity
The Data Granularity setting offers control over the depth of visibility and monitoring provided by CodeTogether HQ. This spectrum ranges from detailed workforce metrics—showcasing data from file-level time investment to aggregate views of engineering efforts—to the anonymous Glass view, which provides a general impression of time allocation without specifics. These settings empower project administrators with the ability to gauge productivity, identify opportunities for development, and appreciate areas of excellence among team members. Conversely, a less granular approach mutes detail in favor of privacy, yielding no individual performance breakdowns and restricting management's ability to discern productivity at a per-developer level.

Capabilities
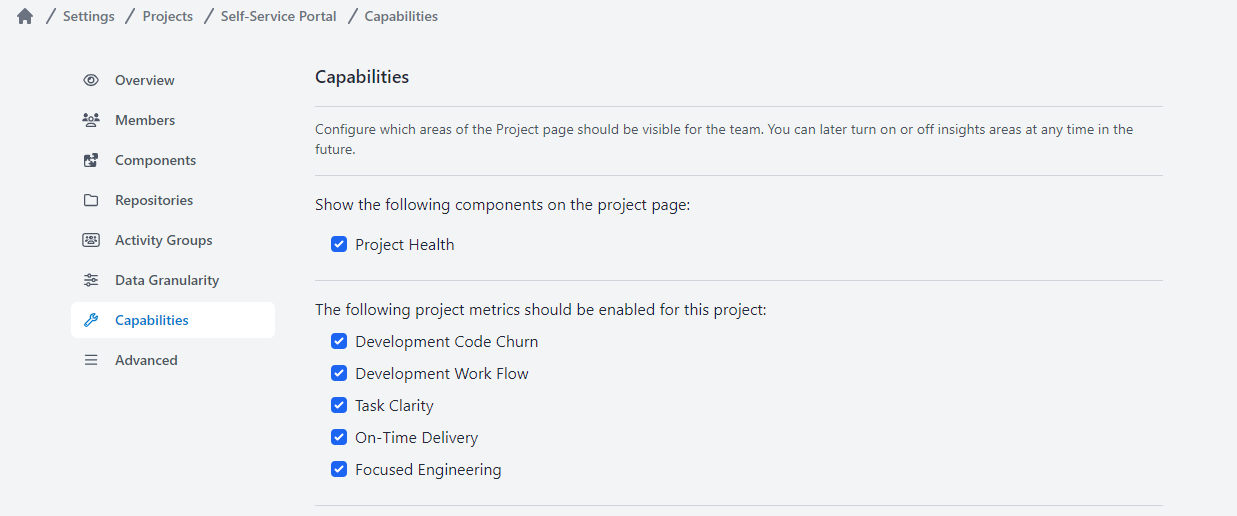
Within the Capabilities section, project leaders can adjust the visibility of various project analytics and features in accordance with organizational preferences. This customization extends to the selection of which project graphs are active for progress tracking, and whether or not to display project health insights derived from CodeTogether HQ's machine learning algorithms on the dashboard. This level of customization ensures that the project pages can be as informative and relevant as desired, aligning with the specific needs and strategic approach of the organization.
User Settings
User settings in CodeTogether HQ provide a personalized interface, allowing you to adjust the application according to your professional identity and preferences. This personalization enhances the user experience, contributing to a more efficient and comfortable development environment.

Overview
In the Overview section of user settings, there is an option for personalizing how you appear within the CodeTogether HQ interface. This encompasses the ability to set or modify your display name and professional title. Adjusting these settings helps in identifying you more clearly to other collaborators within the CodeTogether HQ environment, enabling better communication and collaboration.
Themes
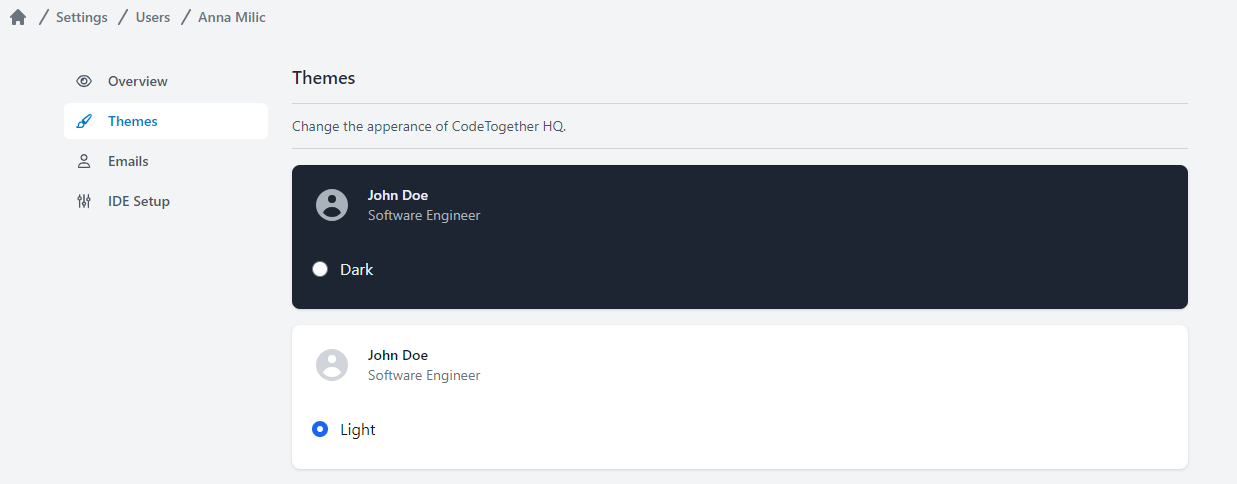
The Themes section is designed to cater to your visual preferences for the CodeTogether HQ user interface. Here, you can toggle between a 'light theme' and a 'dark theme', depending on which one is more comfortable for your eyes or suits your working conditions better. It's an accessible way to customize the aesthetic of your workspace and can help in reducing eye strain during long coding sessions.
Emails
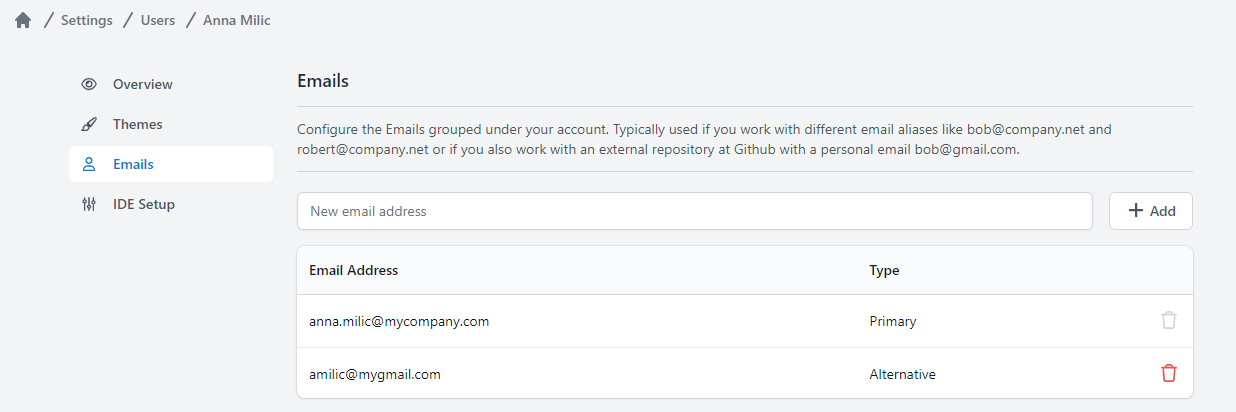
Configuring your email settings is crucial for associating your commits with your user account across various Git clients and within your Integrated Development Environment (IDE). The Email Settings section is where you can link multiple email addresses to your CodeTogether account. Not only does this ensure your contributions are correctly attributed to you, but it also streamlines your presence in the interface, facilitating a cleaner and more organized display of your work across the platform.
IDE Setup
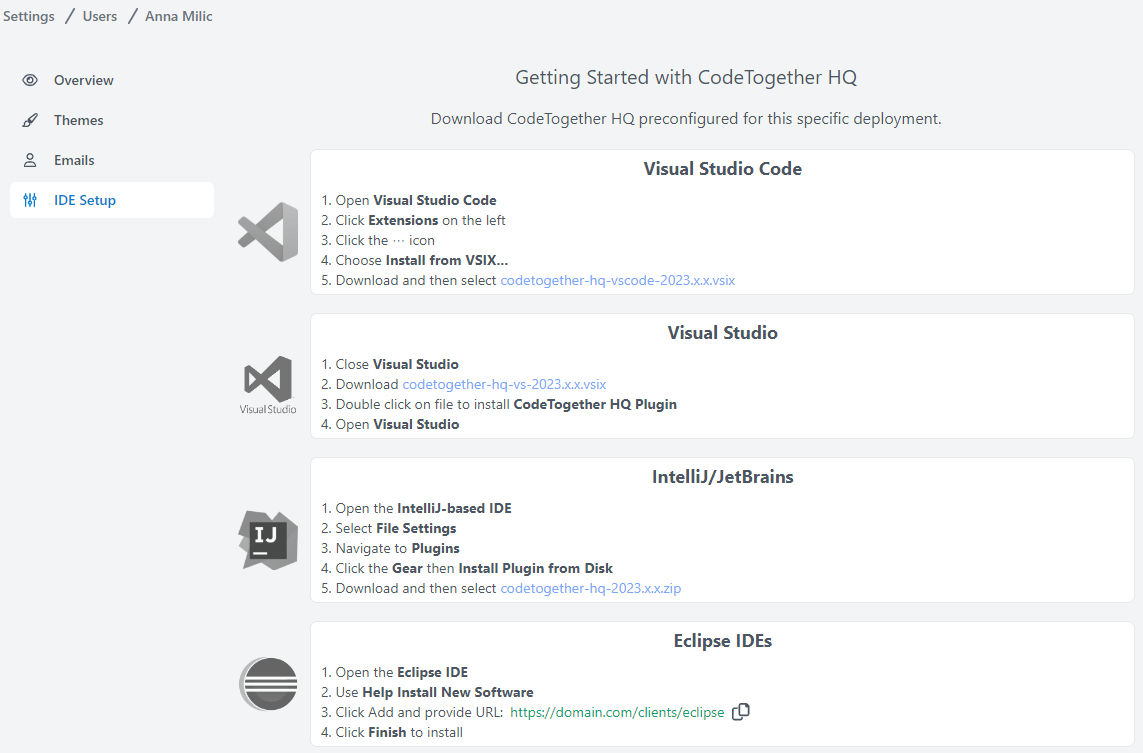
In the IDE Setup section, you will find comprehensive instructions and links to download the latest CodeTogether HQ plugins. This is essential for integrating CodeTogether HQ's capabilities into your local IDE. Regardless of how many IDEs—or individual instances of Visual Studio Code—you have installed, we recommend installing the CodeTogether HQ plugin in each of them. All instances will communicate with a single background service (daemon), which prevents any significant memory usage that would occur if a separate daemon were running for each window or IDE instance. This shared use of resources aims to maintain optimal performance without compromising the functionality provided by CodeTogether HQ.
System Settings
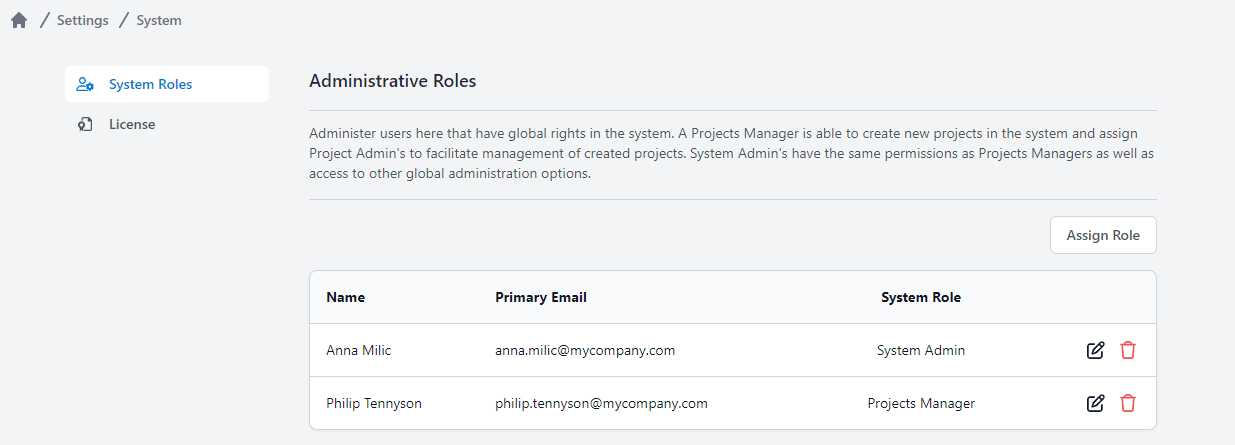
System Settings in CodeTogether HQ are specifically designed for those with higher-level privileges, such as System Administrators or Project Managers. To access these settings, click the Controls icon located in the bottom-left corner of the portal to the right of your user name.
System Roles
Assigning roles is a straightforward process in CodeTogether HQ, but it requires that users have logged in at least once with their Single Sign-On credentials. Once a user has been documented in the system, you can assign them as either a Project Manager or a Global System Administrator. Both roles have the authorization to create new projects within CodeTogether HQ. However, being the creator of a project does not necessarily grant immediate access to all projects. Access to additional projects requires permission from the respective project's administrator, who can add individuals either as members or observers.
License
The License Settings are an invaluable part of System Settings, allowing you to review and renew the current CodeTogether HQ license as needed. It is here that you can keep an eye on the expiration date of the license, ensuring continuous uninterrupted access to CodeTogether HQ services. If you encounter a license that is nearing expiration, it is recommended to reach out to either your System Administrator or your CodeTogether sales representative to acquire a new license. This preemptive step helps avoid any potential operational disruptions.
