Using the On-Premises Dashboard
The on-premises dashboard presents useful information on CodeTogether Live usage in your organization. It provides access to real-time information, historical usage trends, and the ability to configure some server settings. The dashboard can be accessed at https://SERVERFQDN/dashboard.
In a multi-server on-premises deployment, the Locator and individual edge servers will have dedicated dashboards—server configuration options are only available in Locator dashboards.
Dashboard
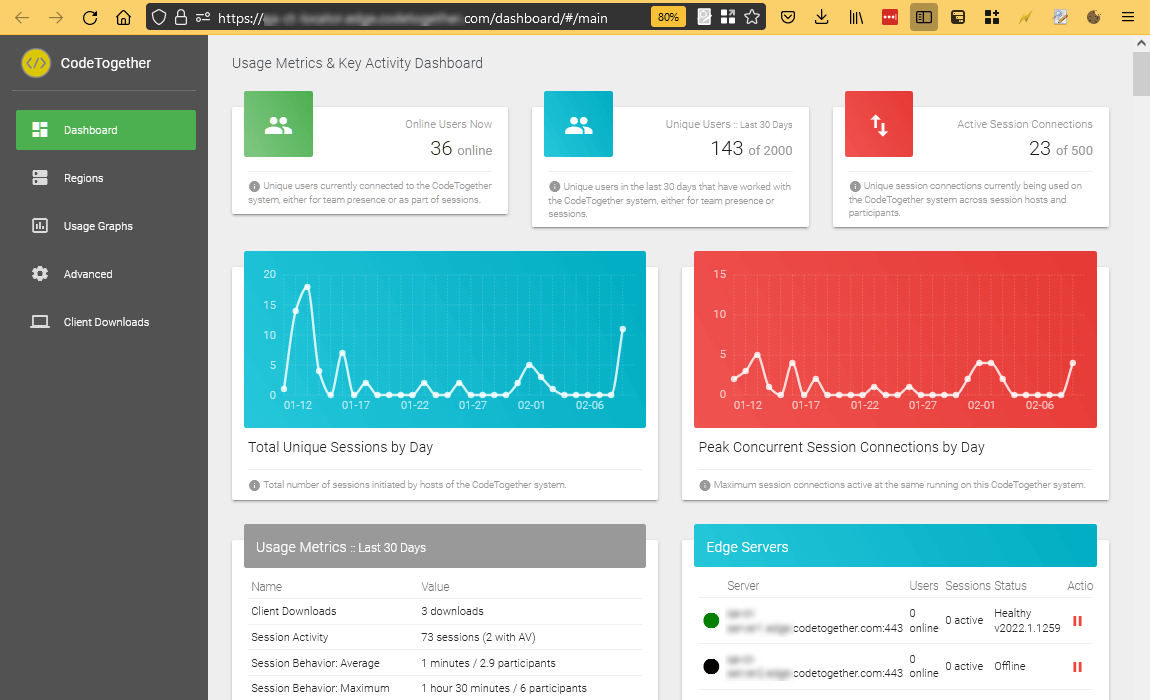
This page displays a count of how many users are currently connected to the server, how many of those are in active sessions, and how many unique users have connected to the server in the last 30 days. The dashboard also displays handy graphs indicating the number of unique sessions per day, and the largest number of concurrent sessions your server handled per day.

There are additional sections on this page which display quick stats like the total number of sessions, average session size, and use of A/V connections. You can also see some recent session activity including start, join and stop events, and edge server related entries. The Edge Servers section will indicate the status of each of your edge servers and the number of users and sessions it is currently handling. You can also suspend the assignment of new sessions to a specific edge server.
The dashboard is password protected to prevent unauthorized access. See CodeTogether Edge Server Technical Notes for details on specifying access credentials.
Downloading Logs and Metrics
The download option is only available in the individual edge server dashboard, the logs/metrics downloaded are specific to the same edge server. For integration with monitoring tools like Prometheus and StatsD, see Metrics Integration.
Use the download button on the top right of the dashboard to download metrics you are interested in. The following logs are available for download:
- Server log file (server.log)—Contains details on server initialization and active configuration settings; contains an abridged version of the sessions log
- Sessions audit log (sessions.log)—Detailed list of session activity. Contains an entry for each time a session was created, or a participant joined/left the session
- Usage log file (usage.log)—An entry is added every 5 minutes with the number of users online and the number of users in sessions
- Detailed metrics (metrics.tar.gz)—This archive contains two files:
- session-metrics.csv—number of sessions per day
- download-metrics.csv—number of client downloads for each IDE per day
Client Downloads
Use the Client Downloads button to download plugins/extensions for different IDEs.
Usage Graphs
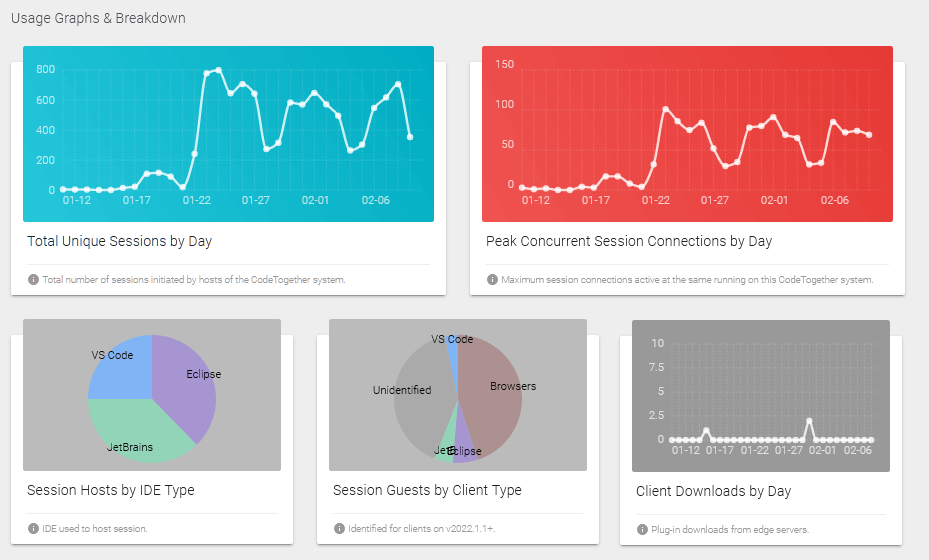
In addition to the unique sessions/peak connections per day graphs, this page also displays charts indicating what IDEs were used to host, and what clients were used to join sessions. It also displays a graph displaying the number of CodeTogether Live clients downloaded per day.

Regions (Locator Server Only)
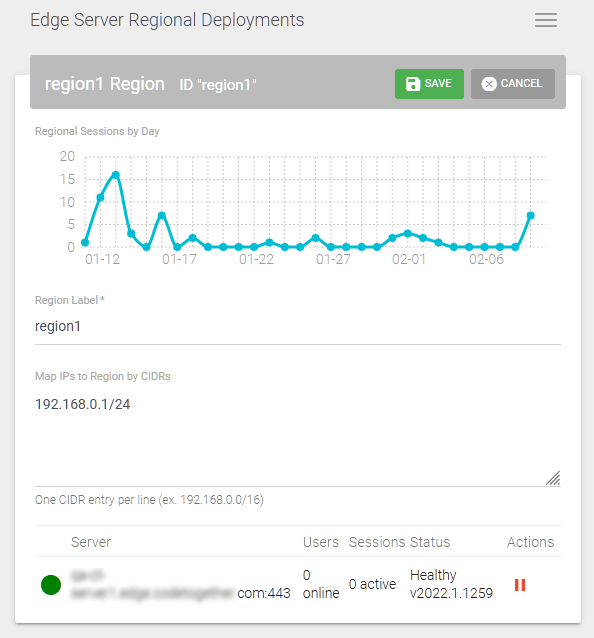
If you’ve configured your edge servers for regional deployment, you can map IPs to each region on this page.
Click the Edit button for the region you wish to edit, and then map IPs to the region via CIDRs. Click the textarea to start adding CIDRs to the region (e.g. 192.168.0.0/16). Enter only one CIDR per line.

Advanced (Locator Server Only)
Client Settings
You can specify the lowest client version that can be used to host sessions on your server.
Metrics Integration
All the stats presented in the dashboard can now be monitored using tools like Prometheus or Graphite, as we expose them using StatsD.
For on-premises deployments using a Locator server, you must configure desired metrics integration via the Dashboard. If not using a locator, the metrics integration must be configured in your Dockerfile, Helm chart, etc., see CodeTogether Edge Server Technical Notes for corresponding configuration instructions.